
Архив офтальмологии Украины Том 11, №2, 2023
Вернуться к номеру
Оцінка стану мікроциркуляції центральної зони сітківки при різних ступенях тяжкості діабетичного макулярного набряку у пацієнтів з цукровим діабетом 2-го типу
Авторы: Сук С.А.
Центр мікрохірургії ока МОЗ України, м. Київ, Україна
Рубрики: Офтальмология
Разделы: Клинические исследования
Версия для печати
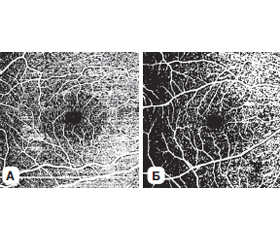
Мета роботи полягала в оцінці зв’язку коефіцієнта мікроциркуляції сітківки, отриманого за даними ОКТА, з прогресуванням ступеня тяжкості діабетичного макулярного набряку (ДМН). Обстежено 82 пацієнти з ЦД 2-го типу (145 очей), розділених на 4 групи відповідно до ступеня тяжкості ДМН. Середній вік пацієнтів становив 65,25 ± 10,85 року, середня тривалість діабету — 14,0 ± 7,05 року, середній рівень HbA1с — 8,40 ± 1,58 %. Контрольну групу становили 20 здорових пацієнтів (40 очей), порівнянних за віком з досліджуваною групою. Коефіцієнт мікроциркуляції (КМ) розраховувався за співвідношенням площі фовеолярної аваскулярної зони та капілярної щільності на бінаризованих знімках ОКТА. Пограничним значенням для КМ поверхневого капілярного сплетення визначено 0,076, а для глибокого капілярного сплетення — 0,025. За допомогою однофакторного дисперсійного і регресійного аналізу було встановлено, що при збільшенні ступеня тяжкості ДМН починаючи зі стадії ДМН 1 значення коефіцієнта мікроциркуляції як у поверхневому, так і у глибокому капілярному сплетенні вірогідно збільшувалось (p < 0,05) порівняно з контрольною групою та попередньою стадією тяжкості ДМН, що вказувало на зростання рівня ішемії, а це негативно впливало на прогноз зорових функцій.
Purpose of the study was to evaluate the correlation of the retinal microcirculation coefficient (MC) according to the optical coherence tomography angiography (OCTA) with the progression of diabetic macular edema (DME). Eighty-two patients (145 eyes) with type 2 diabetes participated in the study. They were divided into 4 groups depending on DME severity: without DME (group 0) — 12 patients (24 eyes), mild DME (group 1) — 18 people (36 eyes), moderate DME (group 2) — 25 patients (43 eyes), severe DME (group 3) — 27 people (42 eyes). The degree of DME severity was assessed according to the international clinical DME severity scale. The average age of patients was 65.25 ± 10.85 years, the average duration of diabetes — 14.00 ± 7.05 years, the average HbA1с level — 8.40 ± 1.58 %. Control group included 20 healthy age-matched people (40 eyes). All patients underwent standard ophthalmologic studies, as well as spectral optical coherence tomography and OCTA (Revo NX device, Optopol Technology, protocol Retina 3D and Retina Angio, 6 × 6). The MC was calculated by the ratio of the area of the foveal avascular zone to the capillary density on binarized OCTA images. The limit value for the MC of the superficial capillary plexus is determined to be 0.076, and for the deep capillary plexus — 0.025. With the help of univariate variance and regression analysis, it was found that with an increase in DME severity, starting from DME stage1, the value of the MC both in the superficial and in the deep capillary plexus increased significantly (p < 0.05) compared to the control group and the previous stage of DME, which indicated an increased ischemia, which negatively affected the prognosis of visual functions.
діабетичний макулярний набряк; цукровий діабет 2-го типу; ОКТА
diabetic macular edema; diabetes mellitus type 2; optical coherence tomography angiography
Для ознакомления с полным содержанием статьи необходимо оформить подписку на журнал.
- Klein R., Klein B.E., Moss S.E., Cruickshanks K.J. The Wisconsin epidemiologic study of diabetic retinopathy. XV. The long-term incidence of macular edema. Ophthalmology. 1995. 102. 7-16.
- Xie X.W., Xu L., Wang Y.X., Jonas J.B. Prevalence and associated factors of diabetic retinopathy. The Beijing eye study 2006. Graefes Arch. Clin. Exp. Ophthalmol. 2008. 246. 1519-26.
- Rubino A., Rousculp M.D., Davis K., Wang J., Girach A. Diag–nosed diabetic retinopathy in France, Italy, Spain, and the United Kingdom. Prim Care Diabetes. 2007. 1. 75-80.
- Yau J.W., Rogers S.L., Kawasaki R., Lamoureux E.L., Kowal–ski J.W., Bek T., et al. Global prevalence and major risk factors of diabetic retinopathy. Diabetes Care. 2012. 35. 556-64.
- Lattanzio R., Brancato R., Pierro L., Bandello F., Iaccher B., Fiore T., et al. Macular thickness measured by optical coherence tomography (OCT) in diabetic patients. Eur. J. Ophthalmol. 2002. 12. 482-7.
- Browning D.J., Fraser C.M., Clark S. The relationship of ma–cular thickness to clinically graded diabetic retinopathy severity in eyes without clinically detected diabetic macular edema. Ophthalmology. 2008. 115. 533-900.
- Davis M.D., Bressler S.B., Aiello L.P., Bressler N.M., Brow–ning D.J., Flaxel C.J., et al. Comparison of time-domain OCT and fundus photographic assessments of retinal thickening in eyes with diabetic macular edema. Invest. Ophthalmol. Vis. Sci. 2008. 49. 1745-52.
- Wang J.C., Laíns I., Providência J., Armstrong G.W., Santos A.R., Gil P., et al. Diabetic choroidopathy: Choroidal vascular density and volume in diabetic retinopathy with swept-source optical coherence tomography. Am. J. Ophthalmol. 2017. 184. 75-83.
- Hwang T.S., Hagag A.M., Wang J., et al. Automated quantification of nonperfusion areas in 3 vascular plexuses with optical coherence tomography angiography in eyes of patients with diabetes. JAMA Ophthalmol. 2018. 136(8). 929-936. doi: 10.1001/jamaophthalmol.2018.2257.
- Kim A.Y., Chu Z., Shahidzadeh A., Wang R.K., Puliafito C.A., Kashani A.H. Quantifying microvascular density and morphology in diabetic retinopathy using spectral-domain optical coherence tomography angiography. Invest. Ophthalmol. Vis. Sci. 2016. 57(9). OCT362-OCT370. doi: 10.1167/iovs.15-18904.
- de Carlo T.E., Chin A.T., BoniniFilho M.A., et al. Detection of microvascular changes in eyes of patients with diabetes but not clinical diabetic retinopathy using optical coherence tomography angiography. Retina. 2015. 35. 2364-2370.
- Matsunaga D.R., Yi J.J., De Koo L.O., Ameri H., Puliafito C.A., Kashani A.H. Optical coherence tomography angiography of diabetic retinopathy in human subjects. Ophthalmic Surg. Lasers Imaging Retina. 2015. 46. 796-805.
- Couturier A., Mane V., Bonnin S., et al. Capillary plexus anomalies in diabetic retinopathy on optical coherence tomography angiography. Retina. 2015. 35. 2384-2391.
- Ishibazawa A., Nagaoka T., Takahashi A., et al. Optical coherence tomography angiography in diabetic retinopathy: a prospective pilot study. Am. J. Ophthalmol. 2015. 160. 35-44. e31.
- Hwang T.S., Jia Y., Gao S.S., et al. Optical coherence tomography angiography features of diabetic retinopathy. Retina. 2015. 35. 2371-2376.
- Spaide R.F., Klancnik J.M., Jr., Cooney M.J. Retinal vascular layers imaged by fluorescein angiography and optical coherence tomography angiography. JAMA Ophthalmol. 2015. 133. 45-50.
- AAO. Diabetic Retinopathy 2014. © 2014 American Academy of Ophthalmology® Updated January 2016, December 2017. www.aao.org/ppp.
- Посібник з біостатистики. Аналіз результатів медичних досліджень у пакеті EZR (R-statistics). В.Г. Гур’янов, Ю.Є. Лях, В.Д. Парій та ін. Навчальний посібник. К.: Вістка, 2018. 208 с.
- Matsunaga D., Yi J., Puliafito C.A., Kashani A.H. OCT angio–graphy in healthy human subjects. Ophthalmic Surg. Lasers Imaging Retina. 2014. 45. 510-515.
- National Eye Institute. Facts About Diabetic Eye Disease. https://nei.nih.gov/health/diabetic/retinopathy. Accessed October 2, 2018.